Introduction
Dashboards
The place where you can get a quick overview of your carnival. The look of the dashboard will change throughout the carnival. Use the right hand side navigation to look at the various stages.
Pre-Carnival Dashboard
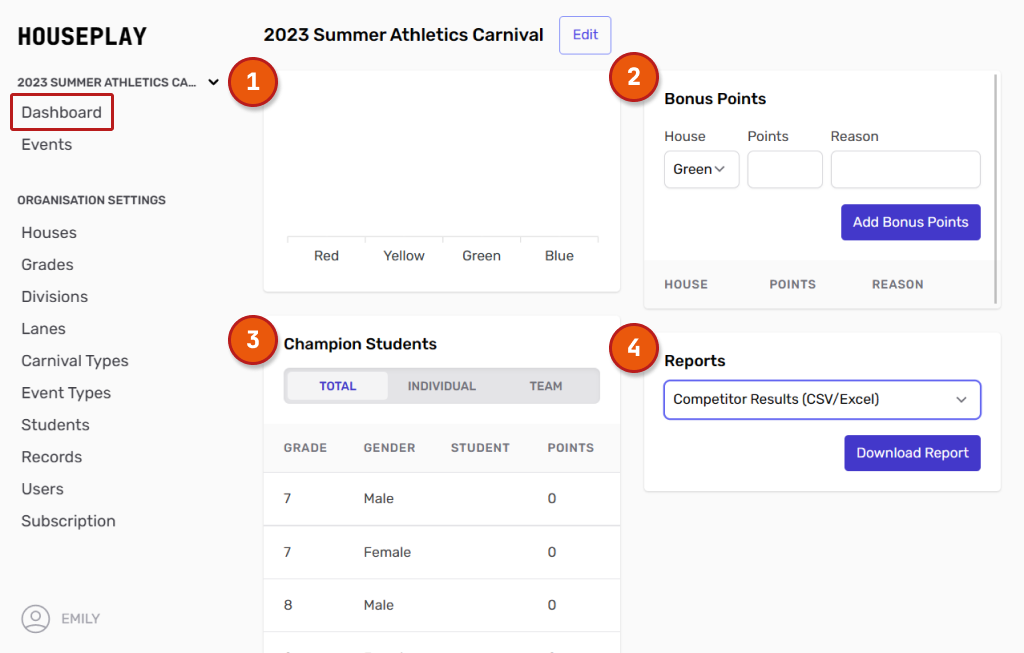
Before the carnival starts, your dashboard will be looking quite empty. As soon as events begin, points are allocated and times entered, things will start taking shape. Let's have a look at some of the sections of your dashboard:

Points Graph - As points start to be allocated, the tally of all points per house or team will be shown here.
Bonus Points Allocation - During the event you may want to allocate bonus points. Learn how to add bonus points in our 'Bonus Points' section.
Champion Students - This section will automatically tally championship students and teams. You do not need to enter anything here, but the information will pull from the results that you enter on the carnival day. You can toggle between championship individual and championship team.
Reports - Run reports on competitor points, students points or event results at the end of your carnival. Learn more in our 'Running Reports' section.
To begin populating this dashboard, you will need to run some events. To learn how to do this head over to the 'Entering Results' page.
Mid-Carnival Dashboard
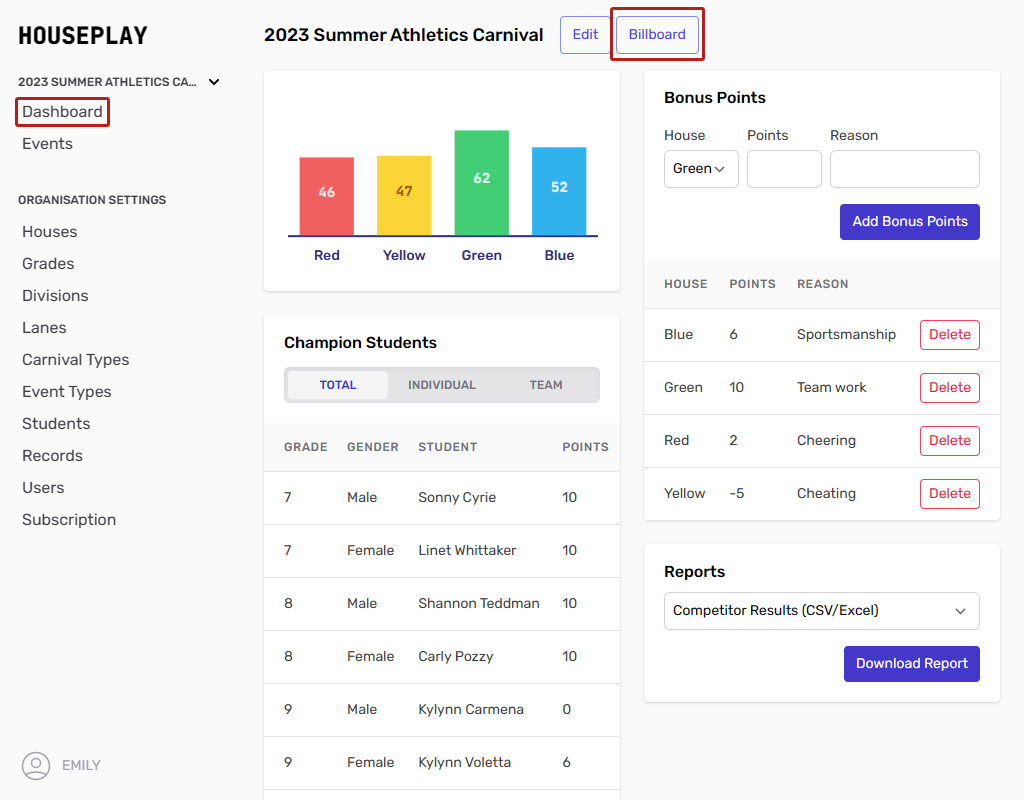
During your carnival, your dashboard will start to look exciting! Something like this:
 The sections discussed above (point graph, champion students, bonus points and reports) will now have useful information in them.
You will notice that there is also a button 'Billboard' at the top of the page. If you click this button, it will take you to a live billboard that you can display on the big screen for participants, teachers and parents to see. This will automatically update as points and results are added.